Trapped Trader And Bulldozer Bar Algo
Order Flow Made Easy
Trapped Trader and Bulldozer Bar Algo
From version 2.1.13, KISS Order Flow has an algo that can automatically highlight Trapped Trader and Bulldozer bars.
For those who are new to trading Trapped Trader and Bulldozer bars, let us explain what they are:
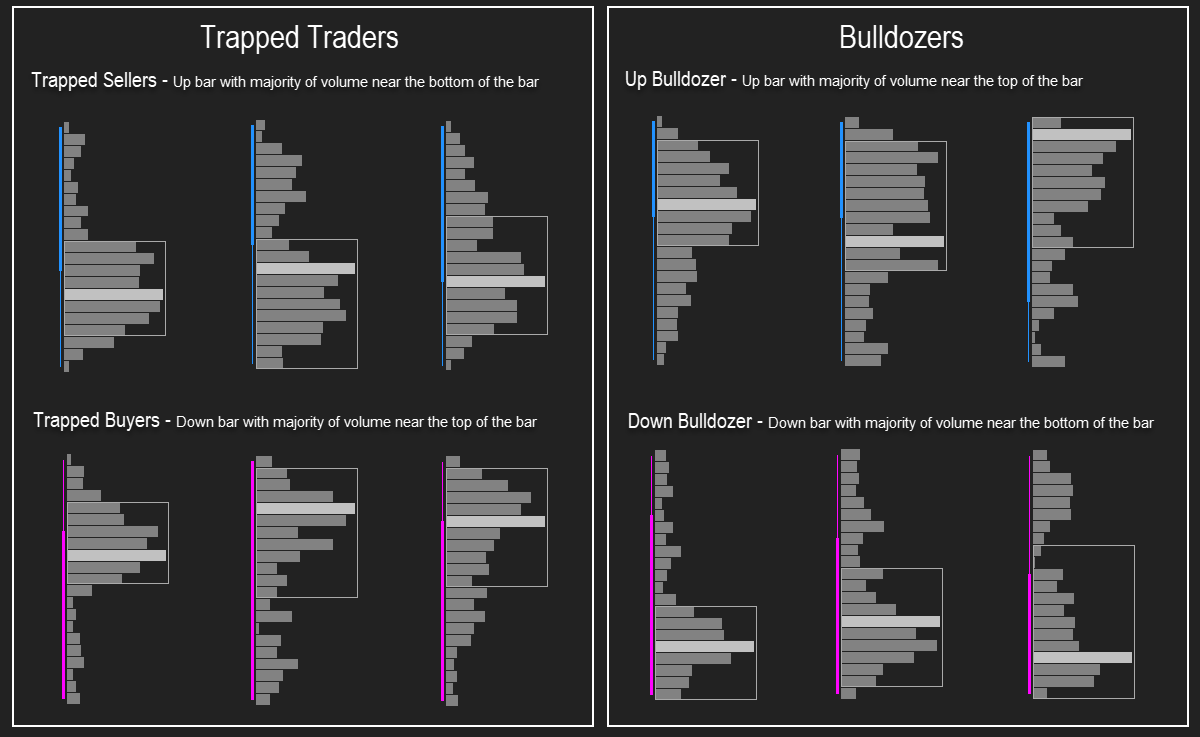
Trapped Trader Bar
A Trapped Trader bar forms when the majority of the volume appears near to where the bar opened. For example:
- A long Trapped Trader bar is an up bar where the majority of the volume is at the bottom of the bar
- A short Trapped Trader bar is a down bar where the majority of the volume is at the top of the bar
A Trapped Trader bar can be a very powerful bar to trade when context is applied. There are many use cases.
Bulldozer Bar
A Bulldozer bar forms when the majority of the volume appears near to where the bar closed. For example:
- A long Bulldozer bar is an up bar where the majority of the volume is at the top of the bar
- A short Bulldozer bar is a down bar where the majority of the volume is at the bottom of the bar
We believe it was Matt (of NOBSTrades) who first coined the name for this special bar. A Bulldozer bar is a strong push in the bar's direction. Again as with Trapped Trader bars, there are many ways this bar can be used.
More and more, we're seeing traders using our indicator as a confirmation tool for their existing trading system. Have an open mind and be creative! There are many ways KISS Order Flow can be used to enhance your trading.
Chart Types
Trapped Traders (or Bulldozer bars) are easier to find on range charts. This is because on a range chart, all the bars are the same size. We recommend using one of the following time frames:
- NQ or MNQ - 20, 30 or 40 range chart
- ES or MES - 10, 12 or 15 range chart
These time frames are a guide, ultimately it's up to you to decide how fast or slow you want your chart to be. The smaller the range chart, the faster the bars will print. If you find a 20 range chart on NQ (or MNQ) too fast to trade, try using a 30 or 40 range chart instead.
Our Algo
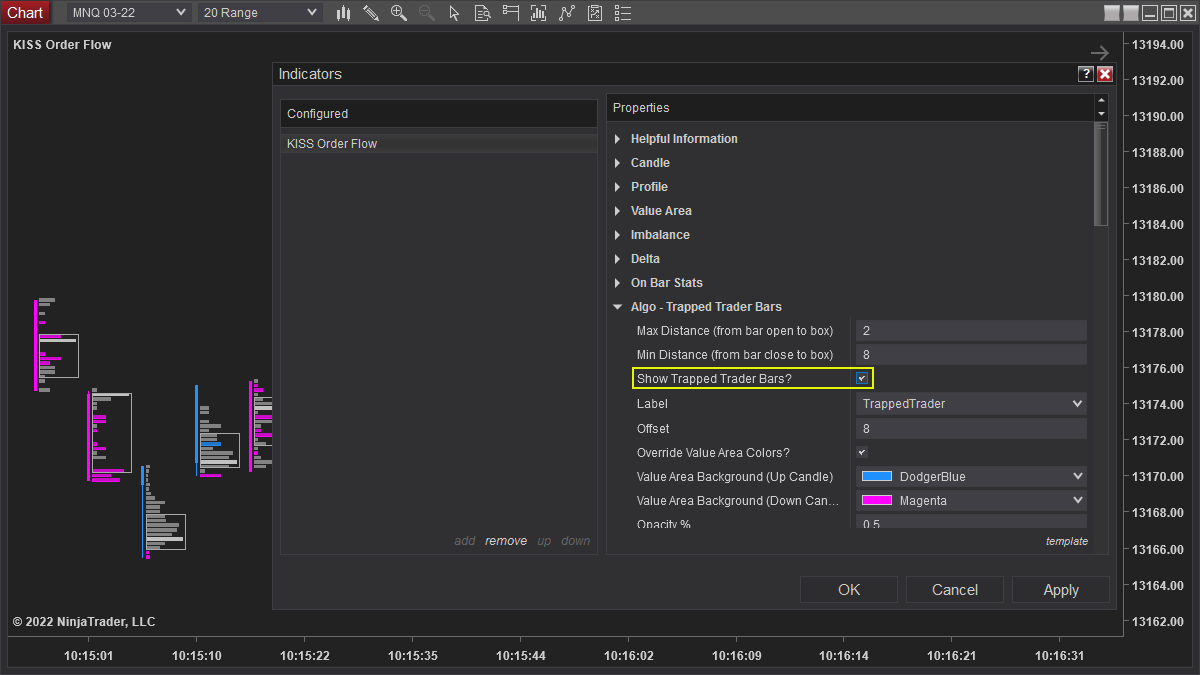
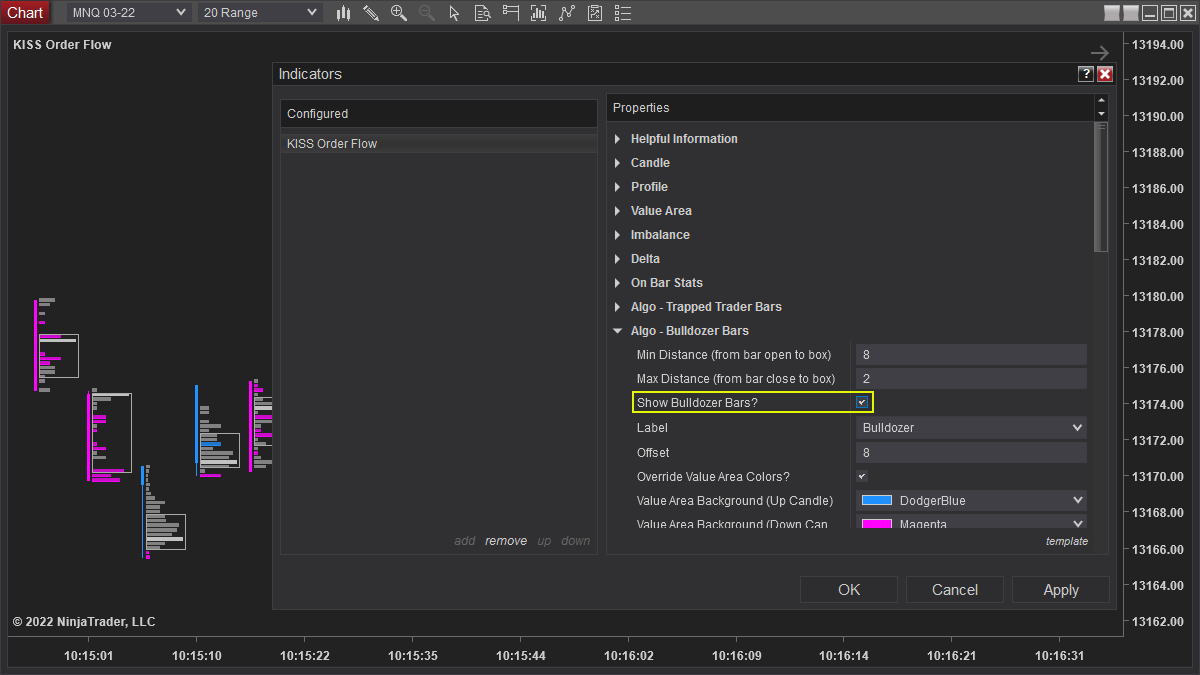
The Trapped Trader and Bulldozer bar algos are disabled by default. To turn them on, go into your indicator settings and put a tick in these boxes:
- Algo - Trapped Trader Bars --> Show Trapped Trader Bars
- Algo - Bulldozer Bars --> Show Bulldozer Bars
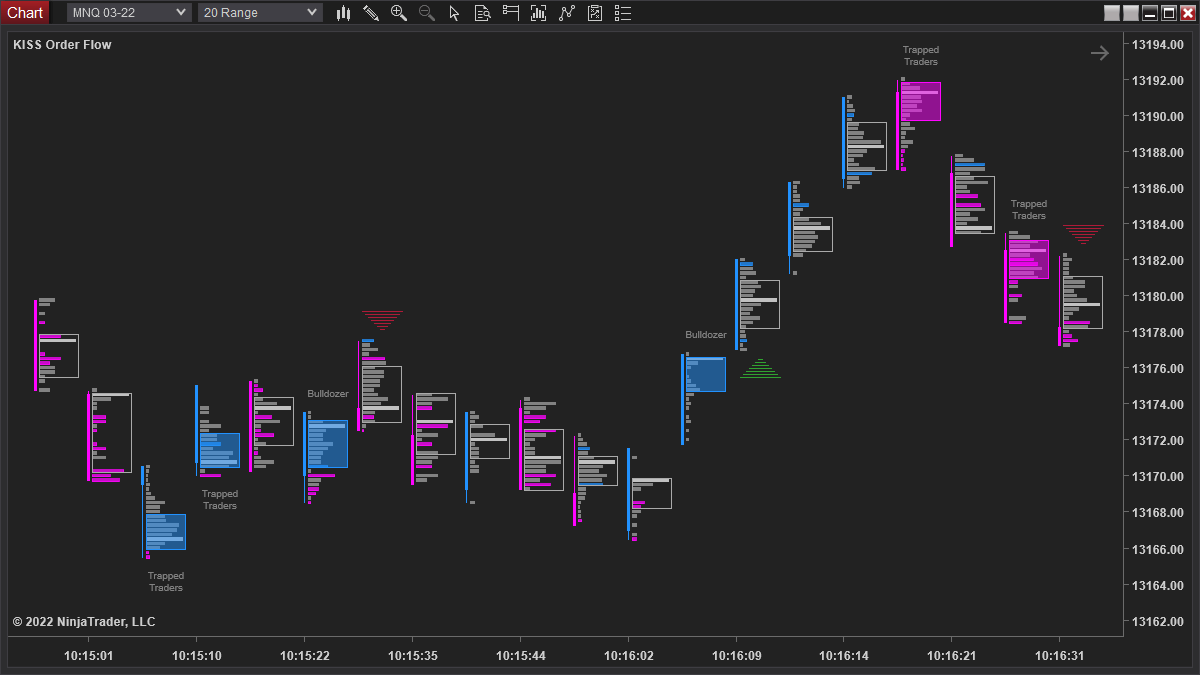
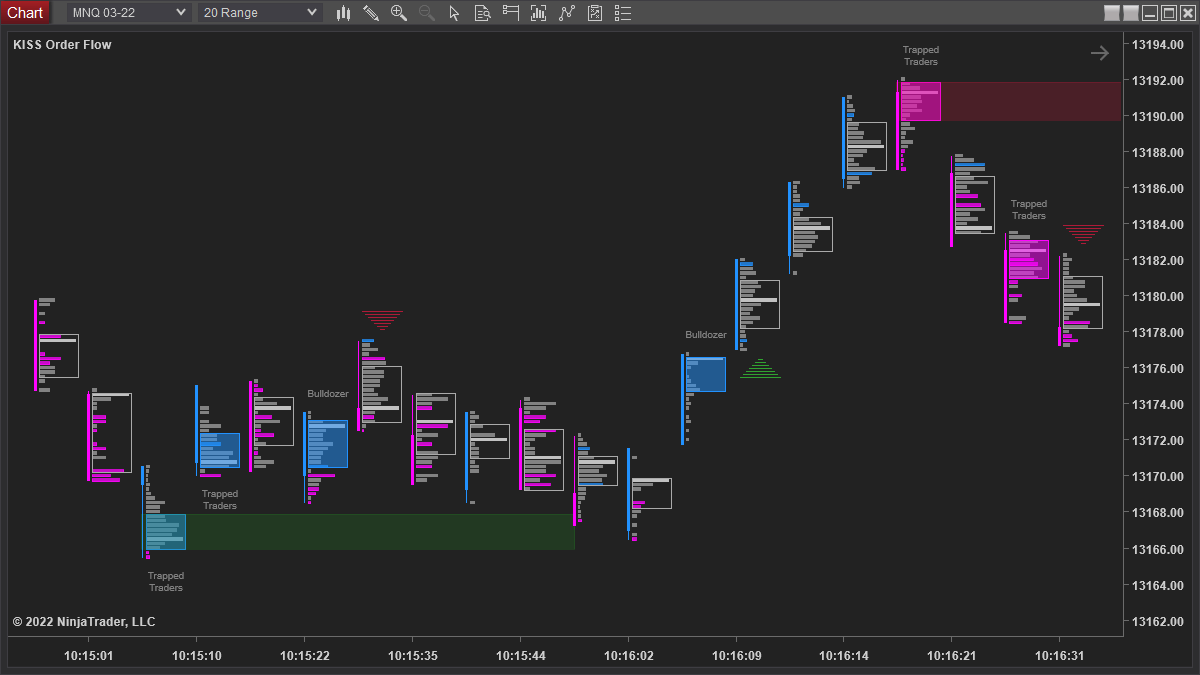
Once enabled, these special bars will be highlighted on your chart:
The definition of a Trapped Trader (or Bulldozer) bar is fully configurable.
You can adjust which bars are highlighted by modifying the Max and Min settings:
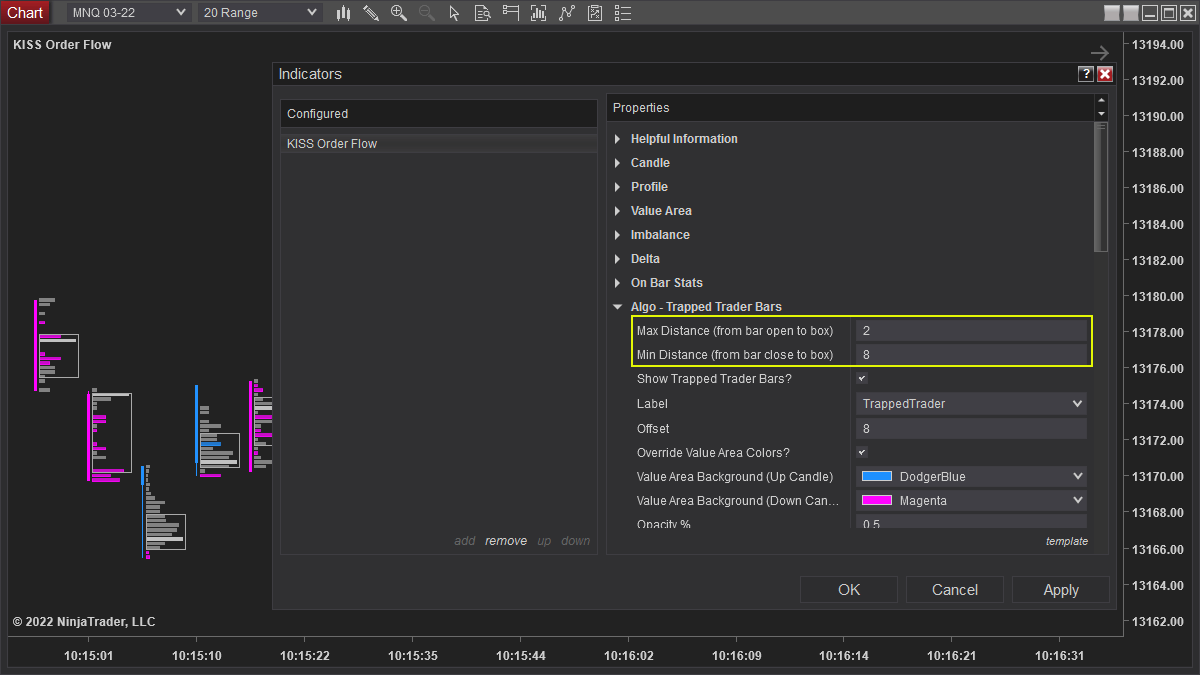
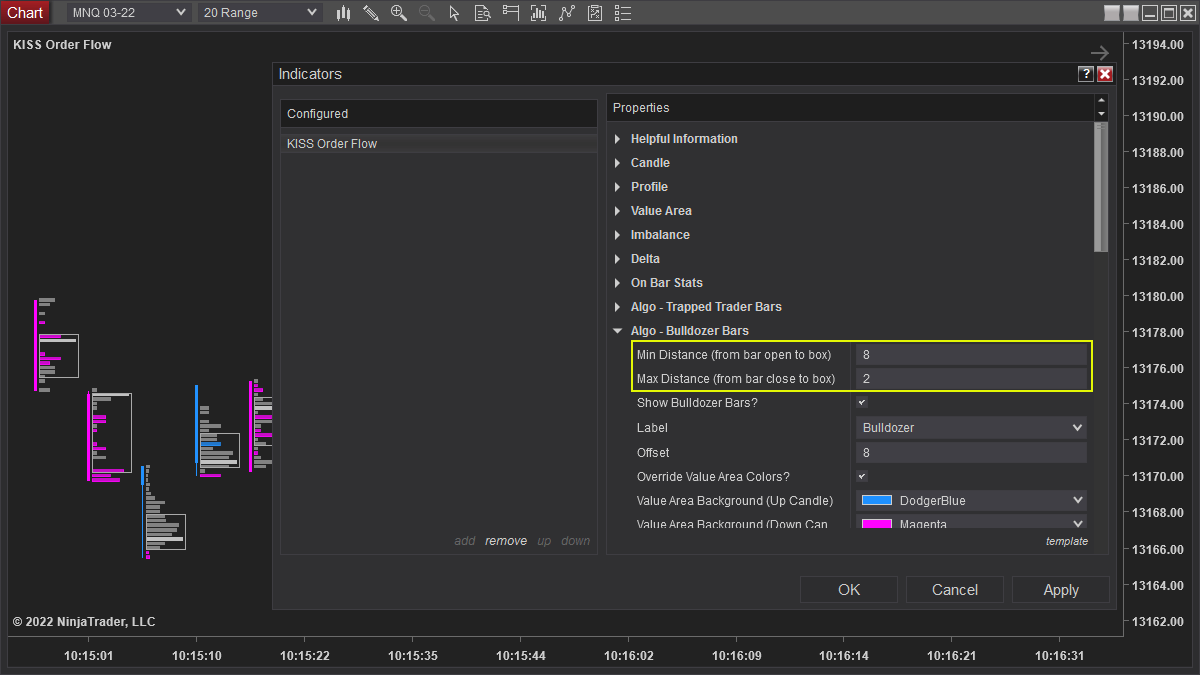
You can adjust these settings to make the Trapped Trader definition stricter (fewer more perfect Trapped Trader bars) or looser (more but not so perfect Trapped Trader bars). We advise all traders to tweak the settings to find a value that works best for the market and time frame that they're trading.
The default settings are a suggested starting point for a 20 range chart on NQ (or MNQ).
If you're using another time frame, you will need to adjust the Min and Max settings.
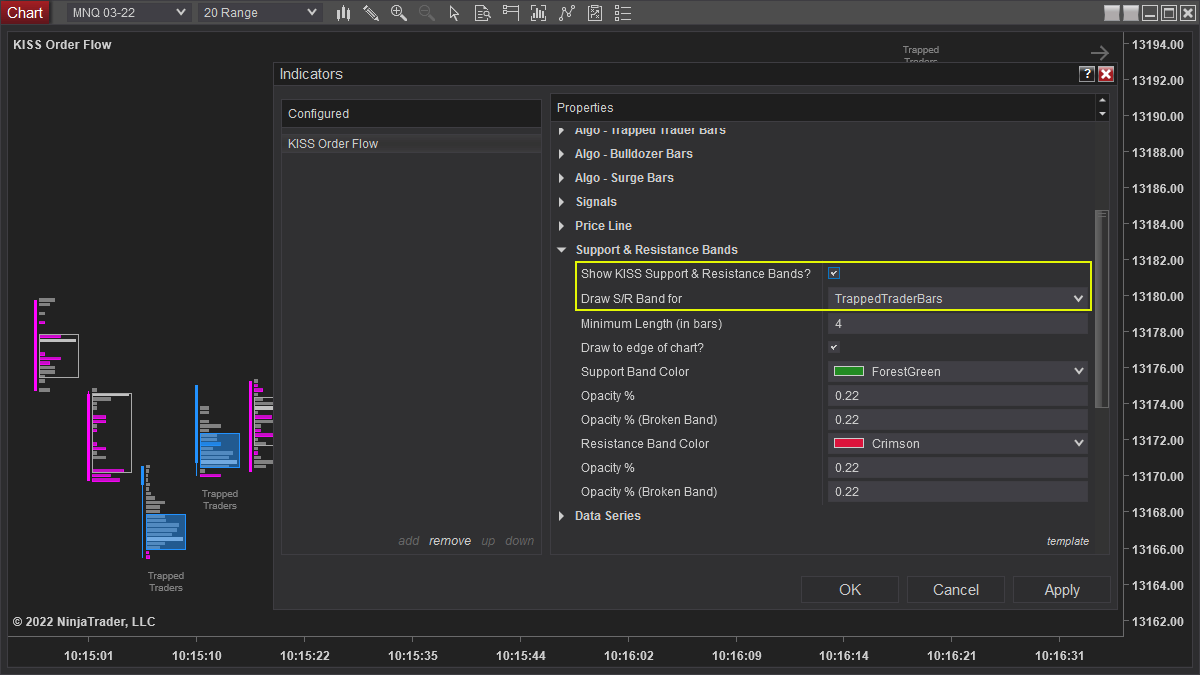
In the latest version, you can also filter the Support and Resistance Bands to only be drawn from Trapped Trader Bars:
© 2025 KISS Order Flow. All Rights Reserved.
Financial Disclosure: Trading Futures, options on futures and retail off-exchange foreign currency transactions involves a substantial risk of loss and is not suitable for all investors. You should carefully consider whether trading is suitable for you in light of your circumstances, knowledge, and financial resources. You may lose all or more of your initial investment. The lower the day trade margin, the higher the leverage and riskier the trade. Leverage can work for you as well as against you; it magnifies gains as well as losses.
Hypothetical Performance Disclosure: Hypothetical performance results have many inherent limitations. No representation is being made that any account or indicator will or is likely to achieve profits or losses similar to those shown. There are sharp differences between hypothetical performance results and the actual results achieved by any particular trading program or indicator. Hypothetical trading does not involve any financial risk, and no hypothetical trading results can account for the impact of the financial risk of actual live trading. One of the limitations of hypothetical performance results is that they are often prepared with the benefit of hindsight. There are numerous other factors related to the markets in general. Only risk capital should be used for trading and only those with sufficient risk capital should consider trading. An investor could potentially lose all or more than the initial investment. Risk capital is money that can be lost without jeopardizing ones’ financial security or lifestyle. No representation is being made that any account will or is likely to achieve profits or losses similar to those shown on this website. Past performance of indicators or methodology is not necessarily indicative of future results.